There is another PivotTable in Office 2000 which is a PivotTable list feature. This is a part of the Office Web Components. This component has the same functionalities as the PivotTable report, but includes capabilities that aren’t available in Excel component. It can function like a ActiveX control and be included in a web page or a Visual Basic application or Microsoft Word document.
PivotTable Report
The PivotTable Repot draws its data in two ways. In the first method, it imports values from an Excel List or a database table and stores the values in memory. When the user manipulates the PivotTable report, the necessary data is retrieved form the memory cache. In the second method, it uses an OLAP cube to derive its data. It communicates with the PivotTable Service of the Analysis Service and retrieves data from the cubes therein.
Let us examine how the PivotTable works
Open Microsoft Excel. Click on ‘PivotTable and PivotTableChart Report’ from the data menu. 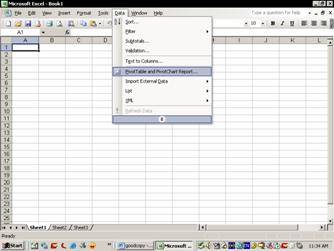
This opens the PivotTable and PivotChart Wizard.


- PAGE FIELDS act like slicers or filters for data. Only members can be used as page fields when a level or dimension is added to the drop area. Members from the measure dimension, for instance, cannot be added to the page fields.
- COLUMN FIELDS AND ROW FIELDS determine the data displayed on the columns and row axes respectively. These axes may contain any type of data from a cube structure except measures.
- DATA ITEMS determine the numerical data portion of the spreadsheet. Only members from the measure dimension can be used as data items.
The toolbar gives the user a list of items from the cube to drop into the PivotTable. Inside the List item tree the user selects the data field required, specifies the row area option and clicks Add To button to add the field to the table. Similarly Column areas are also to be specified and the measures to be used are defined with reference to the items in the row group
Manipulating the PivotTable
The PivotTable is used for non technical people and hence has a simple drag and drop interface. It allows multiple dimensions on row and column axes and multiple member as page fields. Drilldown operations can be performed using the drop down list boxes and by double clicking the members listed in either of the axes. Sub totals and grand total are calculated automatically and displayed. The Format Report and Table Options in the PivotTable Toolbar can be used for customizing the look and feel of the PivotTable. Advanced functionalities of the PivotTable can be accessed by right clicking on the column or row heading of a PivotTable and select Field Settings from the pop up menu.
The PivotChart draws its values from the PivotTable. It provides all the functionalities common in charting programs. Users can select from a variety of chart types, sort data, perform TopCount operations and use formulas to manipulate the cube data.
In the next tutorials we drill down into greater details on how to build, manipulate and process cubes using the various services provided in the Analysis services.
[catlist id=181].