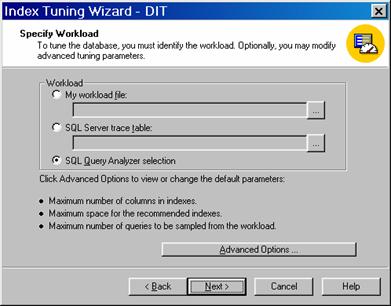
On the Query menu click on Index Tuning Wizard and follow the steps of the wizard. On the Specify workload screen select SQL Query Analyzer Selection and click Next.
 |
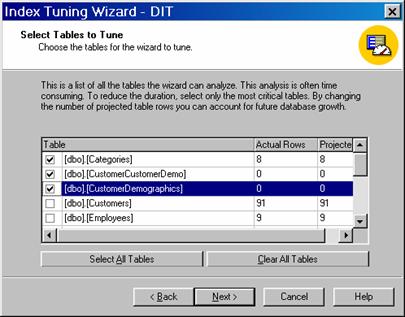
Select the tables and their indexes

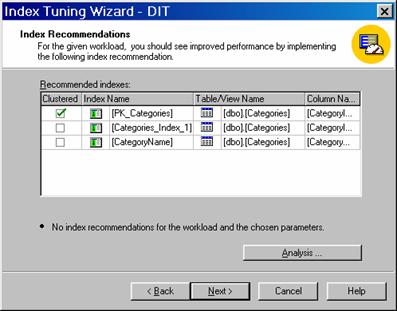
View the recommendations made by the Wizard.

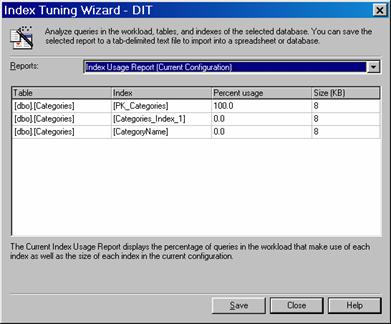
On click Analysis button the users can see the various reports on Index usage, Table Analysis etc.

Once the indexing of the dimension tables is done and optimized the cube processing becomes faster. The cubes can be further optimized using the Usage Analysis Wizard and Usage based Analysis Wizard to fine tune aggregations.
Aggregation selection is an art that has to be refined over time with usage pattern analysis and data analysis.
{mospagebreak}
Analyzing Usage patterns
To produce on screen report of the cubes query patterns, Analysis Services provides the user with a tool called the Usage Analysis Wizard. We have discussed how this tool is used in the above sections, so we will not go into the details of it here. We will be content with a reiteration of its features. The tool is used in conjunction with the Usage Based Analysis Wizard. The content of the reports are drawn from the Log files and the same can be tailored by setting the criteria of selection of data from the Log. The reports that can be generated by the Usage Analysis Wizard are:
1. Query Run Time table: This report gives details of the run time of queries from the longest to the shortest run time
2. Query Frequency Table: The frequency of queries ordered from the most to the least are displayed
3. Active User table: Reports on details of users and the number of queries sent by them ordered from the most to the least.
4. Query response Graph: A graphical representation of response time
5. Query By Hour Graph: The total number of queries processes, grouped by the hour, graphically presented.
6. Query By Date Graph: Graphical presentation of queries sent, grouped by date.
The next tool is the Usage Based Optimization Wizard. This has also been discussed in detail in the foregoing sections. This is used to optimize aggregations based on usage by end users. It is used in tandem with the Usage Analysis Wizard. It is helpful in optimizing all the partitions of the cube individually. Existing aggregations can be replaced or new aggregations can be created using this wizard. The storage mode of the partition or cube can also be changed using this wizard. The partitions/cubes can be processed after the aggregations are set and the partitions are optimized. The Usage Based Optimization Wizard is nothing but the Storage Design Wizard with a few screens built into its front.
Query Enhancements also help in optimizing server performance and cube data analysis. Use of stored procedures, refinement of SQL statements, Creation of surrogate keys on tables with multipart primary keys, use of hints, Ad hoc caching, scheduling of events in the usage trough and inspection of triggers could go a long way in enhancing query performance.
Tuning up Windows 2000 and fine tuning SQL Server settings also help enhance performance.
1. Windows 2000 should be set to maximize data throughput for network applications. This can be done by navigating to Settings>Network and Dialup connections> Local Area Connections>Properties>File and Printer Sharing and selecting Maximize data throughput by clicking on Server Optimization.
2. Performance boost for front end applications should be disabled. Click Control Panel>System>Advanced tab> Performance Options button. Change the Application Response to Background services.
3. Select a different virtual memory for Windows and SQL Server. Navigate to Performance Options as above and under Virtual memory select Change and make the adjustment.
4. Increase receive buffers of the Network Interface card. Navigate to Computer Management MMC >Device Manager>Network card and select Advanced Tab. Select Property: Receive Buffers and set the value to 1024 or whichever is the highest value available.
Fine tune SQL Server settings by doing the following
1. In the Enterprise manager Right click on the server instance and select properties. The minimum memory for a query is set at 1024 at the bottom of the default setting for minimum memory for a query. This has to be advanced upto 2GB. The default max server memory option need not be tampered with as it is set at maximum anyway.
2. In the Database settings tab, the Recovery Interval default is set to 1 minute. This is ideal for the development environment but should be 8-16 minutes for production environment.
3. Set the Priority boost to 1 on a dedicated server
4. Tune Network packet size depending on the size of the end user packets. Use 1024 byte increments.
5. AWE enabled in server is to be set to 1. This enables the server to use Windows 2000 Address Windowing Extensions to support large address spaces.
To summarize Optimization tuning involves refinement at every level. The hardware, the software and the databases have all to be tuned to give optimum performance. The data warehouse tables have to be indexed, an intelligent storage strategy will have to be framed, the correct and considered level of aggregations will have to be selected, good high quality SQL statements and query parameters will have to be used and so on… The list can be endless, depending on the issues encountered and the environment and usage intensity etc. The above covers only a few aspects of optimization tuning in the SQL Server 2000 Analysis Services.
In the lessons that follow we will be going into greater detail on different aspects of cubes and dimensions and also touching upon MDX queries to enhance queries.
[catlist id=181].
