Cells store the value at the intersection of dimension coordinates. Whenever a query is made on the data, the results have to be fetched from the various locations of cells on the multidimensional structure, affecting response time. Aggregations consist of all the possible combinations of one level from each dimension in the cube. This makes query response time optimal.
However storage and processing time required for aggregations can be considerable. The storage requirements are defined by the number of dimensions, measures, levels and members in the dimension. The tradeoff is between storage requirements and the percentage of possible aggregations that are to be precalculated. If no aggregations are precalculated, storage only for the base data is required. Query response time will also be slow because base data will have to be worked upon each time a query is made. When aggregations are precalculated, other aggregations can quickly be computed from the existing aggregations. This impacts on query response time positively but on storage space negatively.
The Storage Design Wizard(see above)and the Usage Based Optimization Wizard (see below) enable the adjustment of aggregation design for a cube. The former provides options for specifying storage and percentage constraints to an algorithm that helps achieve a satisfactory tradeoff between query response time and storage requirements. The latter assists in aggregation design by analyzing queries that have been submitted by clients and refining the aggregation design accordingly.
Though aggregations are designed using the above said wizards, they get created only when the cube is processed. If the structure of the cube changes subsequent to creating the aggregation and processing the cube, the aggregations will have to be redesigned and the cube processed again.
In the object hierarchy aggregations are subordinate to a specific partition of a cube. If the cube contains only one partition, then the aggregations will be considered to be subordinate to the cube. It is because of this, that the above two wizards will require the selection of a partition if they are run on a multiple partition cube.
The Local cube partition’s aggregations are stored locally if the storage mode is MOLAP or HOLAP, in a subfolder of the Data folder of the Analysis server on which the partition is defined. If the partition was created on a remote Analysis server, then, the aggregations are stored remotely in MOLAP or HOLAP storage modes. In ROLAP storage mode, whether local or remote the partitions aggregations are stored in dedicated tables or indexed views in the database specified in the partition. We will learn more about how aggregations are stored in partitions in the lesson “Managing Partitions”
When programming with Decision Support Objects (DSO), the class type associated with aggregations is clsAggregation.
Managing aggregations in a Dimension
In situations where one or more users of a group need to have access to a dimension that is not required by other members of a group, Analysis services gives the user an option of controlling the way the aggregations of the dimension enter the pool of aggregations. The aggregation options Top Level Only and Bottom Level only can be set in such circumstances. Setting the Top Level only option results in effectively removing the dimension aggregations from the pool. As long as the user does not traverse the hierarchy of the dimension, the values of the dimension will be All Level. and responses for the users not requiring the dimension will be fast.
The Bottom Level only flag has the opposite effect. It prevents the aggregations for a dimension above the lowest level of detail. All users will be forced to pay a performance penalty even when they do not use the dimension.
Aggregation usage property can be set to Custom. This allows the user to disable or enable specific levels within the dimension. Manual control of dimension aggregations is not very efficient. Setting the usage control flags merely controls how levels from the dimension will enter the available pool for consideration by one of the Storage design wizards. Changing the setting has no effect until the wizard is run for designing new aggregations for a cube.
{mospagebreak}
Usage Based optimization
Where the Storage Design Wizard selects aggregations from a pool of potential aggregations, the Usage_based Optimization Wizard uses usage patterns to rank aggregations from within the pool. The queries made by clients are used to define patterns and these patterns are used to select the aggregations from the pool.
Populate the Usage Log
Usage patterns are captured from the query log. The query log is an Access database named Msmdqlog.mdb located in the folder containing the Analysis Services executable files. The server logs one out of ten queries by default. The sampling frequency can be increased if the user needs to add more entries to the log. To change the sampling frequency the user has to change a property of the Analysis server and then the server has to be stopped and restarted.
To start the process right click the Analysis Server in the Analysis Manager and select Properties. The following dialog box opens. Click on the Logging Tab to display the following properties
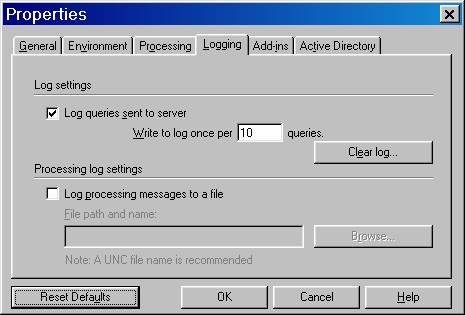 |
Type 1 in the “Write To Log Once Per_____box. Remove old entries in the log by clicking on the Clear log… button. Confirm the clearing on the popup message dialog box.

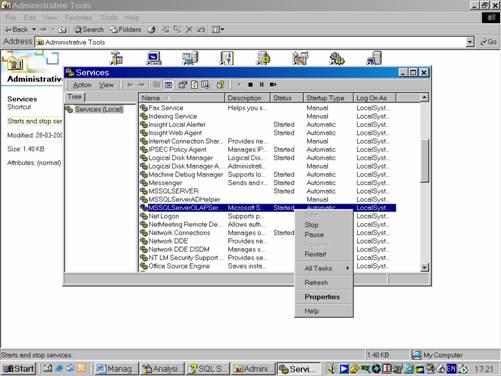
Now go to the control panel and double click Services.
Select MSSQLServerOLAPService in the service list. Click stop service and then click start service
|
|
Switch to Analysis Manager. Right Click the Sales cube and Click Browse data.
In the window that opens perform some queries by dragging and dropping some dimensions, members etc to add entries to the log. Each manipulation in the browser generates a query in the server.
Close the browser window.
{mospagebreak}
View Usage Analysis Reports
The reports generated for usage analysis help the user decide what adjustments need to be made to aggregations.
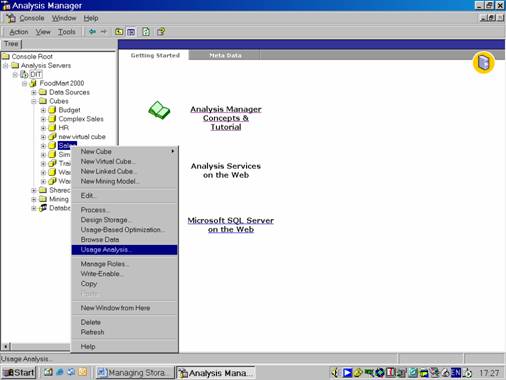
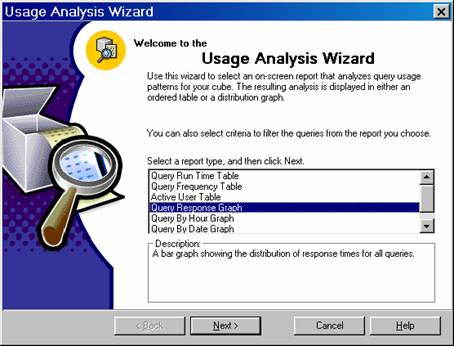
Right click the Sales cube, and click on Usage Analysis to start the Usage Analysis Wizard.
|
|
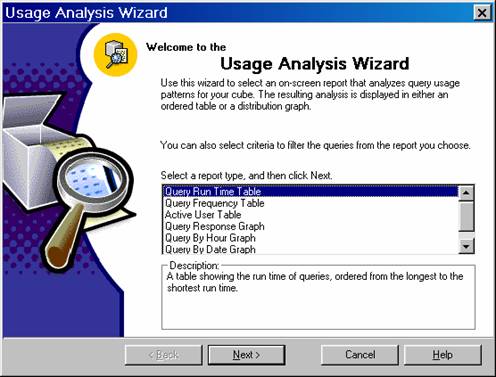
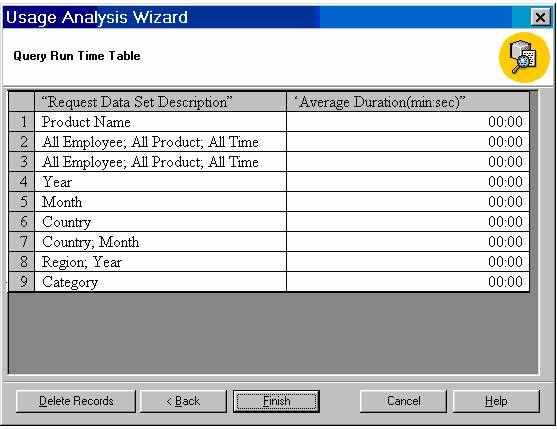
Select Query Run Time Table and Click Next
|
|
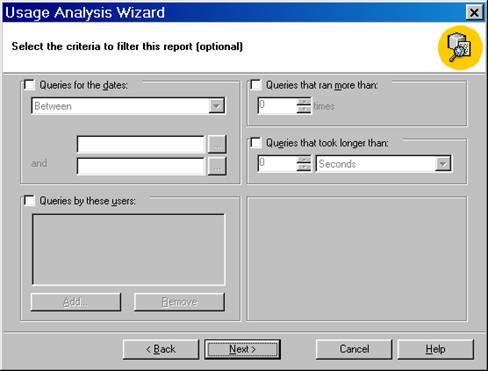
Notice that there are options for setting criteria. Do not set any criteria and click Next. The user can filter the report based on the date of query, the number of times the query ran and how long it took to run the query or when the user executed it.
|
|
Let us review the report.
|
|
To see the graph, the user will have to navigate back two screens and select the Query Response Graph Report and then click twice to see the graph.
|
|
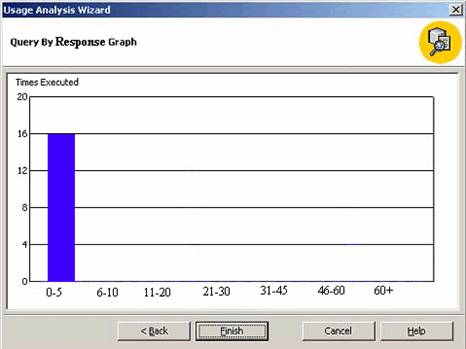
Click Finish to close the Usage Optimization wizard.
[catlist id=181].

