The graph theory refers to the study of graphs. A graph is a mathematical object that captures the notion of connection. For example, you want to connect two or more dots that could be considered a graph. Leonhard Euler is the inventor of graph theory, as he tried to solve the known problem of the Seven Bridges of Konigsberg.
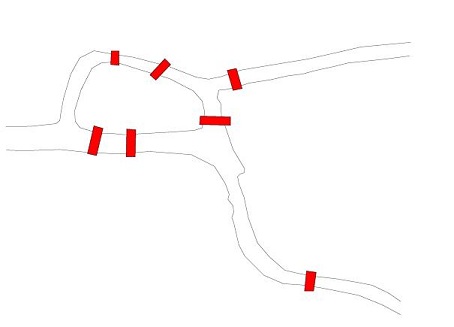
The townspeople supposedly posed the question “Is it possible to take a walk through town, crossing each of the seven bridges just once, and ending up wherever you started?”
A representation of the bridges:

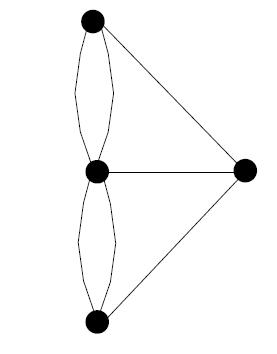
Euler realized that all the points on the island (for example) were equivalent as far Mobdro Download App the question was concerned, so the island as well as the banks and the promontory could be represented with single points:

Notation:
A graph G is a pair of sets V and E together with a function f : E -> V x V . The elements of V are the vertices (a.k.a. nodes or points) of G. The elements of E are the edges of G. The function f sends an edge to the pair of vertices that are its endpoints, thus f is known as the edge-endpoint function. This terminology is unfortunate since f is generally only a relation.
Connections generally come in two forms, Mobdro APK those that are non-directional (e.g. the bridges of Konigsberg) and those that have an implicit direction (e.g. from one dot to another dot only). To distinguish these two cases we really need to define two different kinds of graphs. Thus the term graph will determine an undirected graph, and the term of digraph will determine a directed graph.
Representation of graphs :
In practice, there are different ways to represent a graph:
- adjacent list – Vertices are stored as records or objects, and every vertex stores a list of adjacent vertices. This data structure allows to store additional data on the vertices.
- incidence list – Vertices and edges are stored as records or objects. Each vertex stores its incident edges, and each edge stores its incident vertices. This data structure allows to store additional data on vertices and edges.
- adjacency matrix – A two-dimensional matrix, in which the rows represent source vertices and columns represent destination vertices. Data on edges and vertices must be stored externally. Only the cost for one edge can be stored between each pair of vertices.
- incidence matrix – A two-dimensional Boolean matrix, in which the rows represent the vertices and columns represent the edges. The entries indicate whether the vertex at a row is incident to the edge at a column.
Example:
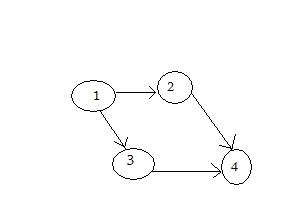
The following example, an incidence matrix, will be used later on:
| 1 | 2 | 3 | 4 | |
| 1 | 0 | 1 | 1 | 0 |
| 2 | 0 | 0 | 0 | 1 |
| 3 | 0 | 0 | 0 | 1 |
| 4 | 0 | 0 | 0 | 0 |
If you look closely at the table from above, at the intersection of 1 with 1, 2 with 2 and so on, the value is 0 because it points to the same node. At the intersection of 1 with 2, the value is 1 which is correct, because we have a road from 1 to 2, but not from 2 to 1, so there the value is 0.
A visual representation of the graph:

Some real life examples of using graphs:
- Shipping routes – The vertices are shipping hubs and the edges are the routes between them
- Telecommunications networks – The vertices are computers on the network and the edges are the network connections between them
- Disease transmission – The vertices are organisms which can carry the disease and the edges represent one organism spreading it to another
[catlist id=197].
