Using the Usage Based Optimization Wizard.
1. When a set of queries have accumulated in the Usage log, the Usage based Optimization wizard can be pressed into service.
2. The task on hand is to select the Logged queries that should be applied and then design aggregations based on them
3. Let us assume that a user has browsed the sales cube and accumulated log entries by manipulating data.
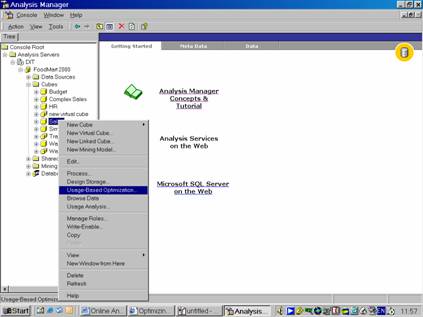
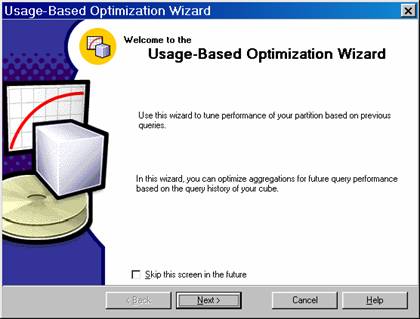
4. Now Right click the Sales cube, click the Usage Based Optimization. Click Next to leave the welcome screen.
|
|
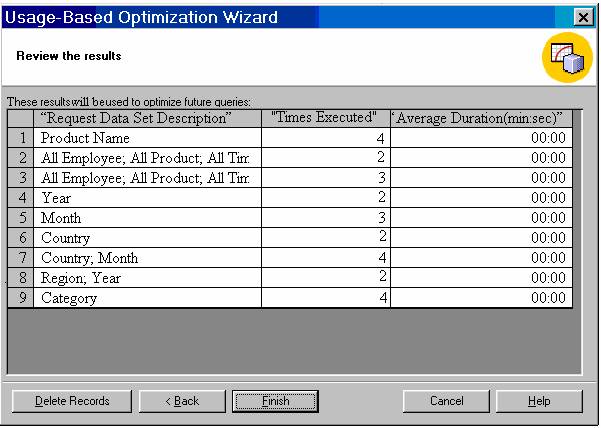
5. On the criteria screen let us select the Queries that Ran more Than…Check box and type 0 in the times box. Click Next to continue to review the filters queries.
|
|
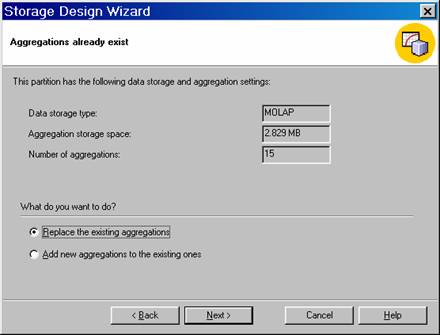
6. On the above screen click Next. The “Aggregations already exists” Storage Wizard screen opens. The user can now add aggregations or replace the existing aggregations.
7. Click Replace The Existing Aggregations and then click Next.
|
|
8. Click the MOLAP Storage option and click Next.
|
|
{mospagebreak}
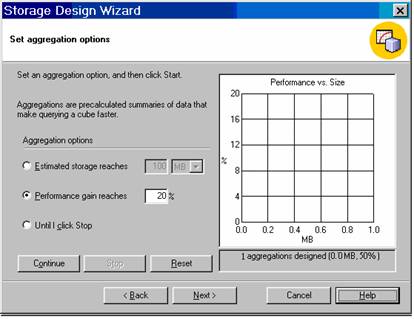
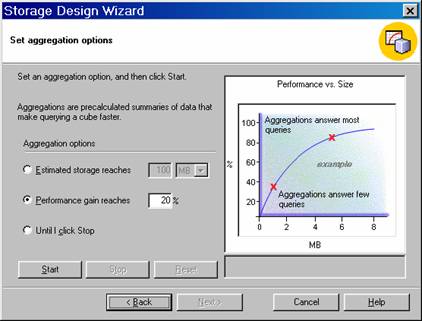
9. In the Set Aggregations Options screen click Performance Gain Reaches at 20% and Click Start.
10. The Storage Design Wizard has used the selected queries from the log and concluded that a 20 percent performance gain can be achieved with a single aggregation.
11. Click Next, click Process Now, Click Finish and then close the Process Log window.
12. In the Console tree, right click the server and click Properties.
13. Click the logging tab. Change the query settings to 10 and click Ok. Click Ok to close the Message box, and then stop and restart the Analysis Server.
The Server Cache and Query Usage
The Analysis Server and the PivotTable service maintain a server cache on the client and on the server. Data retrieved on queries are stored in the cache and retrieved from there for every subsequent query. If the Administrator is in the habit of clearing the cache periodically, it would be useful to include queries to the server cache in the Usage based optimization pattern. This can be done by selecting this option in the selection criteria screen.
Manipulating the Query Log
When a cube is modified or redefined, the log entries become meaningless. The user can delete such log entries by clicking the Clear All button in the Logging tab of the Server Properties dialog box. But since the server log contains the log entries for all queries on all cubes, this may not be a good choice. If the user wants to delete only the log entries relating to a particular cube, he can right click the cube, Click on Usage Analysis, navigate to the screen that displays the logs for that cube and click Delete Records at the bottom of the report.
Old query logs can be extracted from the log database or can be filtered for only new log entries when optimizing aggregations. To do this–On the Usage-based Optimization Wizard’s criteria screen, select the Queries For the Dates check box, Click After in the drop down list and select the date the cube structure was last modified in the date-box.
[catlist id=181].

